Few things frustrate a developer more than hitting F5 only to see Visual Studio pop up an error Unable to start debugging. The startup project could not be launched. This issue can occur regardless of the programming issue, as it is related to the debugging utility. In this post, we are going to see what you can do if Visual Studio is unable to start debugging.
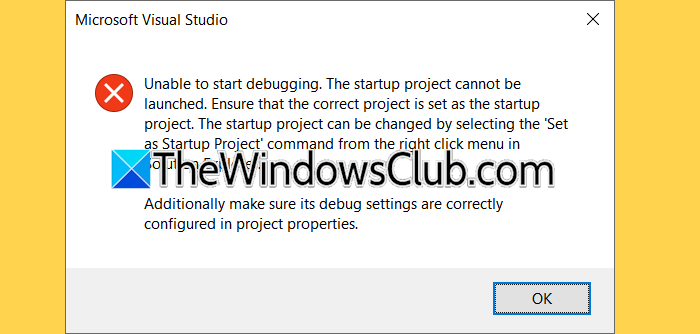
Unable to start debugging. The startup project cannot be launched. Ensure that the correct project is set as the startup project. The startup project can be changed by selecting the ‘Set as Startup Project’ command from the right click menu in Solution Explorer.
Additionally make sure its debug settings are correctly configured in project properties.
Visual Studio unable to start debugging
Visual Studio may not start debugging for several common reasons. First, a corrupted or misconfigured launchSettings.json file can stop the debugger from attaching to your application. If you’re using IIS Express to host your web projects, it might be broken or missing important components. Antivirus software may block the debugger from creating new processes or writing to temporary folders. You may also have the wrong startup project selected, or Visual Studio might not have the administrator privileges needed to bind to ports or access system resources. Lastly, a damaged Visual Studio user cache or installation can disrupt debugging in any language.
If Visual Studio cannot start debugging, follow the solutions below.
- Set the correct startup project and enable debugging
- Repair IIS Express (for Web Projects) or Reinstall relevant runtimes
- Delete and regenerate launchSettings.json
- Disable Antivirus Real-Time Protection or Add Exclusions
Let us talk about them in detail.
1] Set the correct startup project and enable debugging
Visual Studio needs to know exactly which project to launch when you press F5. If the solution has multiple projects and none is marked as the startup project, or if debugging is disabled for that project, the debugger has nothing to attach to. To set the correct startup project and enable debugging, follow the steps mentioned below.
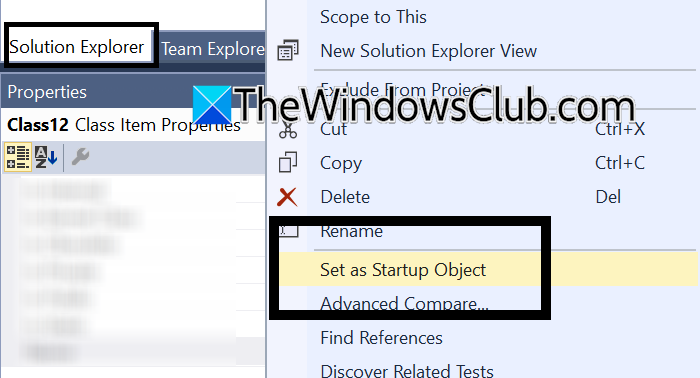
- In the Solution Explorer, right-click on your main project.
- Then, select Set as Startup Project from the context menu.
- Right-click on the same project again and choose Properties.
- Go to the Debug tab or the Web tab for web projects.
- Now, ensure Enable Debugging is checked (for C++, look under Debugging > Launch; for Python/Node.js, check Enable native code debugging if needed).
- Now, press F5 again to test.
Finally, check if the issue persists.
2] Repair IIS Express (for Web Projects) or Reinstall relevant runtimes
Web projects that use ASP.NET, Node.js, or Python often use IIS Express as the default web server for debugging. If IIS Express is corrupted or missing, Visual Studio cannot start the web host. Similarly, if the language-specific runtimes like Node.js, Python, or .NET Core get damaged, reinstalling them will fix the debugger and allow your process to start again.
To do the same, follow the steps mentioned below.
- Open Control Panel.
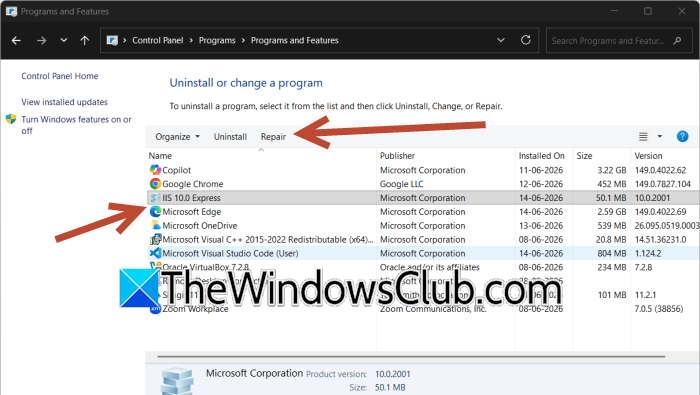
- Now, go to Programs > Programs and Features.
- Scroll down to IIS Express and select it.
- Click on Change or Repair.
- After the repair finishes, repair or reinstall the runtime for your project:
- For Node.js: Repair Node.js installation from the official installer.
- For Python: Repair Python from the Microsoft Store or official installer.
- For .NET: Download and repair the .NET SDK or Hosting Bundle.
- Restart your computer and test debugging again.
Hopefully, this will do the job for you.
3] Delete and regenerate launchSettings.json
The launchSettings.json file stores profiles, environment variables, and application URLs for debugging. Corruption or incorrect entries in this file confuse the debugger. Deleting it forces Visual Studio to create a fresh, working copy based on your project’s current configuration. This applies to any project type that uses a web server or custom launch profile.
- Close Visual Studio completely.
- Open File Explorer and navigate to your project folder.
- Open the Properties folder inside your project (if it exists). For non-.NET projects, look for a launchSettings.json inside .vs or Properties.
- Locate the file launchSettings.json and delete it.
- Reopen Visual Studio and load your solution.
- Rebuild the solution (Build > Rebuild Solution).
- Press F5.
Visual Studio regenerates the file automatically.
4] Disable Antivirus Real-Time Protection or Add Exclusions
Many antivirus programs, including Windows Defender, can interfere with Visual Studio. They may block essential functions, like creating temporary debugger files or attaching the debugger to a running process. This problem affects all programming languages. To fix this, you can temporarily turn off real-time protection to identify the issue. For a permanent solution, add exclusions in your antivirus settings. This way, you ensure everything works smoothly without compromising your security.
You need to follow the steps mentioned below to do the same.
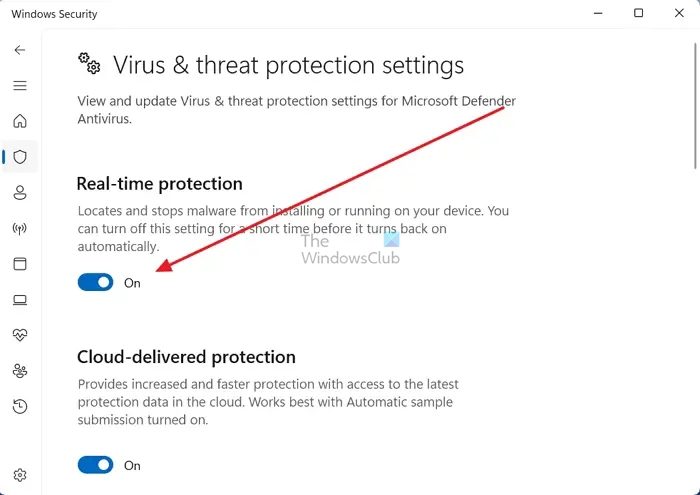
- Temporarily turn off real-time protection in your antivirus. In Windows Security, go to Virus & threat protection > Manage settings > Real-time protection > Off.
- Test debugging by pressing F5.
- If debugging now works, re-enable real-time protection and add the following exclusions:
- Visual Studio’s installation folder (e.g., C:\Program Files\Microsoft Visual Studio\2022)
- Your project’s source code folder
- The debug output folder (e.g., bin\Debug, out\Debug, __pycache__, node_modules)
- For Windows Security, go to Virus & threat protection > Manage settings > Exclusions > Add exclusion.
- After adding exclusions, turn real-time protection back on.
Now, check if the issue persists.
Hopefully, with the help of these solutions, your issue will be resolved.
Read: Unable to connect to web server IIS Express Visual Studio
Why can’t I Debug in Visual Studio?
Visual Studio fails to start debugging for several common reasons. You might have the wrong startup project selected, or debugging could be disabled in your project properties. A corrupted launchSettings.json file often confuses the debugger, especially in web projects. Running Visual Studio without administrator privileges can block port access and process attachment. Antivirus software may interfere by scanning or blocking the debugger’s operations. IIS Express, which hosts many web projects, can become corrupted. Finally, a damaged Visual Studio user profile or installation cache silently breaks the debugging pipeline. Identifying the specific cause usually requires testing the solutions in order.
Read: Visual Studio Code: The window has crashed
How to enable debugging in Visual Studio?
To enable debugging, first ensure your desired project is set as the startup project (right-click it in Solution Explorer and select Set as Startup Project). Next, open the project’s properties, navigate to the Debug tab, and confirm that Enable Debugging is checked. For web projects, verify that your launch profile exists and points to a valid URL. If debugging still fails, run Visual Studio as Administrator, delete any corrupted launchSettings.json file, repair IIS Express, or reset user data using devenv /resetuserdata. Always rebuild your solution before trying again.
Also Read: Visual Studio, The system cannot find the file specified.