Visual Studio Code is widely regarded as one of the best IDEs on the market. However, it has its fair share of issues that one needs to tackle. Recently, we have noticed that VS Code is unable to connect to a browser. This prohibits us from connecting to the localhost or launching Chrome for debugging, in some cases, even after installing the extension. In this post, we are going to talk about this issue and see what you can do to resolve it.

VS Code unable to connect to browser
If VS Code is unable to connect to the browser, you need to follow the solutions mentioned below.
- Use Debugger for Chrome alternatives
- Create a new JSON File
- Try Chrome Remote Debugging
- Reinstall Microsoft Edge Debugger
- Reinstall Visual Studio Code
Let us talk about them in detail.
1] Use Debugger for Chrome alternatives
Many users are still using the Debugger for Chrome, even though it is no longer supported. It was discontinued because Visual Studio Code now has a built-in JavaScript Debugger. This built-in tool works without needing an extension and provides the same features. It supports Node.js, Chrome, Edge, WebView2, and VS Code extensions, so there is no need for external debugging tools.
Instead, you can use Chrome DevTools. This tool is built into Google Chrome and helps developers fix, analyze, and improve websites. It includes helpful features like Element Inspector, Console, Network Monitoring, Performance Analysis, and JavaScript Debugging.
2] Create a new JSON File
When launching a website in Chrome and on your localhost, you may encounter an error that says – This site can’t be reached. This is because the website is the JSON file that you are currently using is not able to connect to your browser. To resolve this issue, we can delete your existing JSON file and create a new one. This is not going to damage your code, as the JSON file is basically only applicable for settings. Follow the steps mentioned below to create a new JSON file.
- In Visual Studio Code, go to your folder, look for .vscode.
- Now, right-click on .vscode and select Delete.
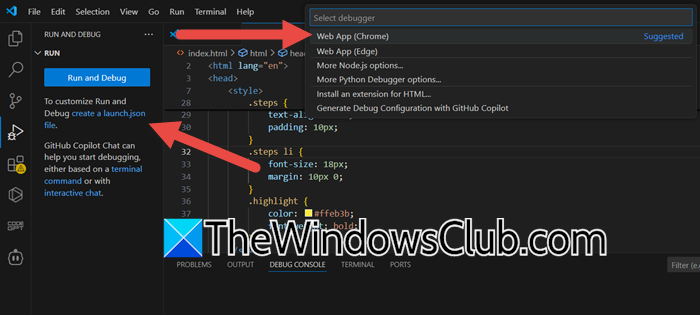
- You now have to go Run and Debug tab.
- Click on the “create a launch json” file hyperlink and then click on Web App (Chrome).
- This will create a new JSON file.
- Now, go to Run > Start Debugging.
Hopefully, this will do the trick for you.
3] Try Chrome Remote Debugging
We have noticed that, at times, when trying to attach Chrome, the following error message appears.
Cannot connect to the target: connect ECONNREFUSED 127.0.0.1:9222
In this case, our best option is to create the JSON file as mentioned earlier. However, assuming that doesn’t work, you can try Chrome Remote Debugging. This method will work regardless of the presence of the aforementioned error message. To get started with it, open Command Prompt as an administrator.

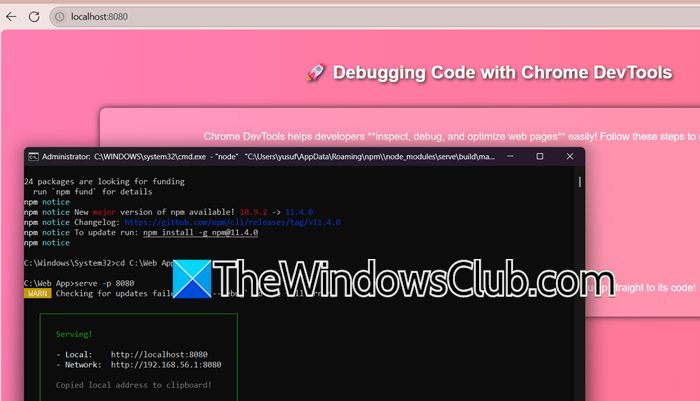
npm install -g serve
Then, go to your app’s folder in the terminal and start the server on port 808.
serve -p 8080
Now, your web app will be available at http://localhost:8080.
To debug Chrome using VS Code, you must enable remote debugging when launching Chrome. Open a terminal and use the following command:
chrome.exe --remote-debugging-port=9222
In VS Code, press F5 and check your launch.json. For web debugging, select “Attach to Chrome” or “Launch Chrome” and set the port to 9222.
This should do the trick for you.
4] Reinstall Microsoft Edge Debugger
This issue is not exclusive to Chrome, although the fact that Microsoft Edge Tools for VSCode has not been deprecated, we have a rather simple solution at hand. In order to resolve this issue, we will have to reinstall the Microsoft Edge Debugger. To do so, you need to follow the steps mentioned below.
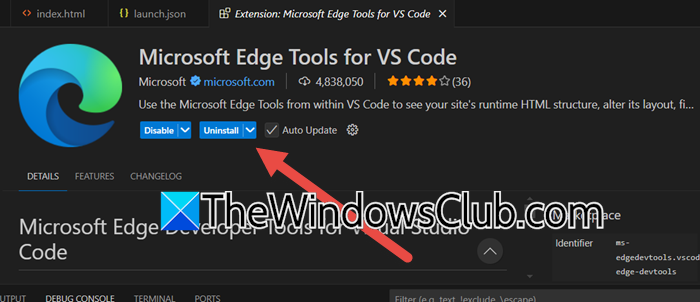
- In VS Code, click on the Extensions tab.
- Now, go through the Installed section, look for Microsoft Edge Tools for VS Code, click on it, and select Uninstall.
- Once Uninstalled, search for “Microsoft Edge Tools for VS Code”, and then click on Install.
Finally, check if the issue is resolved.
5] Reinstall Visual Studio Code
If nothing worked, our last resort is to reinstall VS Code. In case the error is because of some misconfiguration or corruption in the files, this solution will resolve it.
We hope that with the help of these solutions, you will be able to resolve the issue with ease.
How do I connect VS Code to my browser?
To connect VS Code to your browser for live previewing HTML/CSS/JavaScript projects, install the Live Server extension from the VS Code Extensions marketplace. Once installed, open your HTML file, click the “Go Live” button in the status bar at the bottom-right corner. This launches a local development server and automatically opens your default browser to display the page, which updates instantly as you edit and save your code.
To change your browser settings in VS Code, open the settings by pressing Ctrl + , then type “browser” in the search bar to find browser-related options like the default browser for previewing web pages. If using extensions like “Live Server”, adjust their specific settings by clicking the gear icon next to the extension name, then set your preferred browser under the “Default Browser” option in the extension’s settings menu.