Resource Monitor is a useful tool in Windows 11/10 that shows graphical representations of how resources are being used over time. This allows us to check the performance counters of specific resources and decide on a course of action to improve performance. There are many ways to launch Resource Monitor and use the application to trace Performance Data.
How to use Resource Monitor in Windows 11/10
Resource Monitor or Resmon lets you easily monitor your CPU usage, memory usage, Disk Activity, Network Activity and more. Like the Reliability Monitor or the Performance Monitor, the Resource Monitor too is a useful built-in tool in Windows.
To launch Resource Monitor, type resmon in Start Search and hit Enter. When you first launch the application, an ‘Overview’ tab gets displayed.
1] Overview tab

As the name suggests, the Overview tab displays basic system resource usage information of other four main tabs:
- CPU
- Memory
- Disk
- Network
The base graphs for each of the four categories offer a basic overview of your system’s current status at a glance.
As you can see, the CPU graph displays the total percentage of CPU capacity currently in use (green curves along the graph)with blue color indicating the maximum CPU Frequency. Alongside it, there’s a Disk graph displaying the total current I/O in green and the highest active time percentage in blue. Similar findings related to the Network graph and Memory graph are also displayed. For Memory, the current Hard Faults per second can be seen in green and the percentage of physical memory in use in blue.
If you are interested in knowing more details about a particular tab, just select the associated tab.
2] CPU
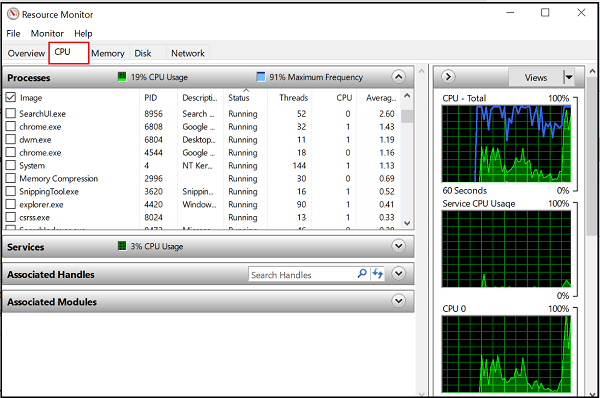
Under the CPU tab, it is possible to filter each view of the given tabs by the process. Simply check the box for that process, and the bottom window will only show the activity for that process. With no processes selected, the bottom windows will transform into an activity page for all active processes. The numeric scale for the graphs on the right will change as activity changes. On the right side, you will see the usage graphs that will help you monitor the CPUs.
3] Memory tab
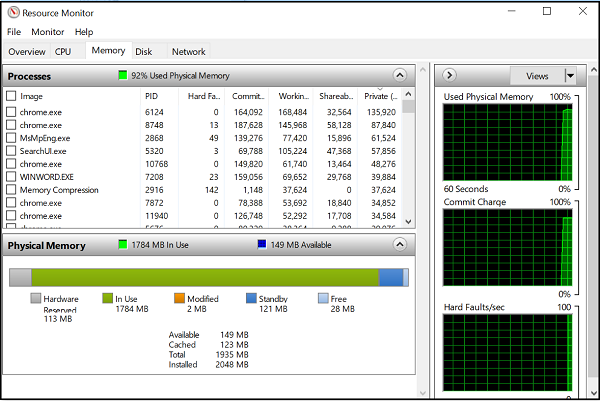
The memory tab shows the memory being consumed by each of the running processes, along with graphs on the right side. This gives us a quick view of what physical memory is being used for. One can easily view the total physical memory and what it is actively used, along with showing what is hardware-reserved. Hardware Reserved represents physical memory addresses that have been reserved by hardware and is not available for Windows to use.
4] Disk tab
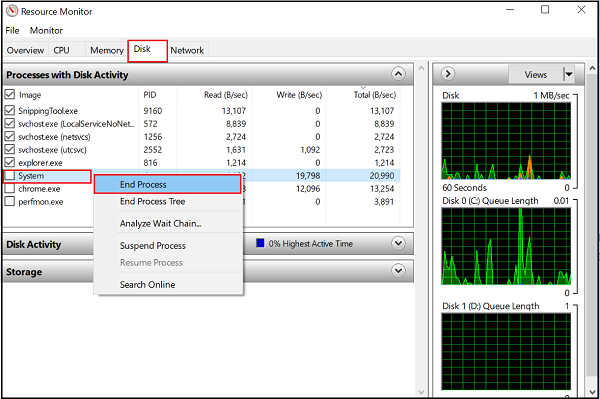
Under the ‘Disk’ tab you will find those processes that are engaged in some Disk activity. At the time you may find some process engaged in a lot of Read-Write activity. Right-clicking on any process will give you the option to End the process, End the complete process tree, etc.
5] Network tab
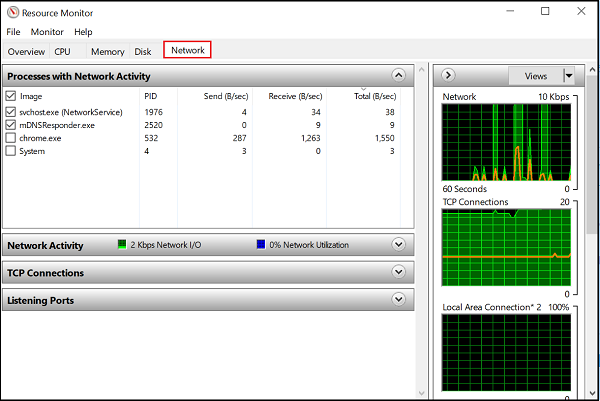
Under the Network tab, you can find which programs are accessing the network and which IP address it is connected to. This helps in narrowing down the problem if you find unusually high network activity.
TIP: See this post if the Resource Monitor is not working.
Thus, the Resource Monitor offers many advantages over previous individual tools like System Monitor, Performance Logs and Alerts, and Server Performance Advisor in a way that it combines the functionality of those tools into a single interface. Besides, it provides a much more in-depth view of system activity and resource usage than previous tools like Task Manager.
Read: Free software to monitor System Performance & Resources in Windows.
What is the shortcut for Resource Monitor in Windows 11?
In Windows 11, the shortcut to open Resource Monitor is by pressing Win + R, which opens the Run dialog box. Then, type “resmon” and press Enter. This quick method grants direct access to the Resource Monitor, allowing you to monitor system performance and resource usage efficiently.
How do I Monitor CPU usage on Windows 11?
To monitor CPU usage on Windows 11, open Task Manager by pressing Ctrl+Shift+Esc. Once open, click on the “Performance” tab, then select “CPU” to view current usage statistics. This provides a real-time overview of how different processes utilize your CPU, helping you manage system performance efficiently.