VMMap is a tool from Microsoft Sysinternals that helps you analyze how processes use virtual and physical memory on Windows. It is essential for developers and system administrators. VMMap lets you see memory usage clearly, identify resource-intensive features, and spot problems like memory leaks. In this post, we are going to see how you can install and use Sysinternals VMMap on Windows 11.

What is Sysinternals VMMap?
VMMap is a tool that analyzes a process’s virtual and physical memory. It shows a clear breakdown of how much virtual memory is used and how much physical memory (working set) the operating system assigns to each type. VMMap has powerful filtering and refresh features to help you see where process memory usage comes from. It displays information in easy-to-understand graphs and provides detailed data that you can export for more analysis or scripting.
Install and use VMMap on Windows 11
If you want to install and use Sysinternals VMMap on Windows, follow the steps below.
- Download and install VMMap
- Use VMMap
- Use Cases
Let us talk about them in detail.
1] Download and install VMMap
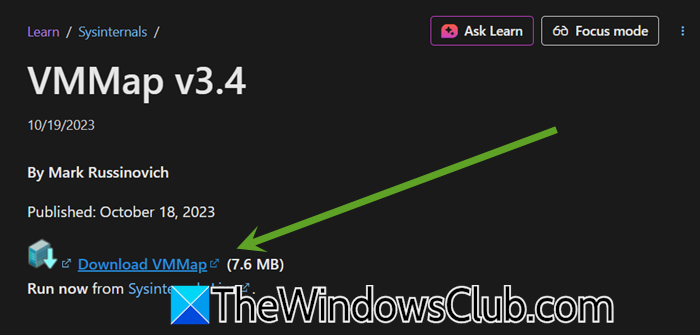
VMMap is a portable tool, so installation is straightforward. You need to get VMMap from the official Microsoft Sysinternals website, learn.microsoft.com. When you navigate to the website, click on Download VMMap.
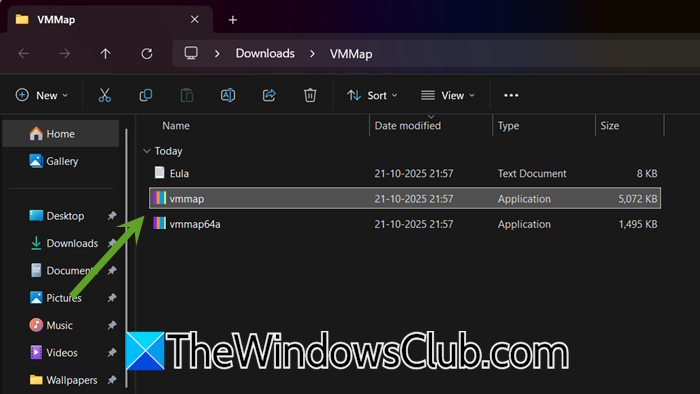
After downloading, extract the contents of the ZIP file to a folder of your choice. Double-click the VMMap.exe file to launch the application. No complex installation or elevated permissions are required.
2] Use VMMap
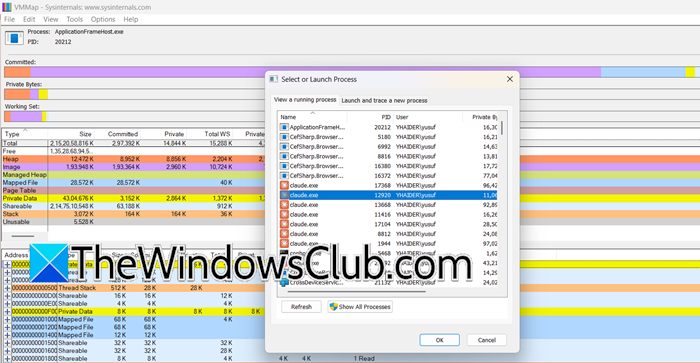
Once VMMap is running, you can start analyzing processes. You will be prompted to select a running process to analyze. You can also start a new process directly from the File > Run menu.
The main window is divided into the following sections.
- Top (Summary & Graphs): Shows a graphical summary of committed memory, private bytes, and the working set.
- Middle (Memory Types): Breaks down memory usage into categories like Image (executable code), Private Data, Mapped File, and Heap.
- Bottom (Detail View): Provides a detailed list of all memory regions with information like start address, size, and protection.
If you want to refresh the memory snapshot, you can hit F5. Use Ctrl+D to see the difference between the current snapshot and the last one, which is crucial for spotting memory changes.
3] Use Cases
VMMap is a useful tool for finding memory problems in applications. It provides more than just basic memory information. When an application shows high memory usage in Task Manager, VMMap explains why by breaking down memory usage into categories such as Heap, Private Data, and Mapped Files. This breakdown helps locate memory leaks. By taking regular snapshots, you can check whether certain types of memory, such as Private Data or “Unusable” blocks, are increasing, which can indicate a leak that needs fixing.
It also helps improve performance. Developers use it to see how much memory different features of the application consume and to identify ways to optimize code that causes high memory usage. The tool shows how memory is organized, which helps identify whether performance problems stem from small, isolated memory blocks. This makes VMMap important for solving issues and improving applications.
That’s it!
Read: Best Free Bandwidth Monitoring Tools for Windows 11
How to use VMMap?
VMMap is a powerful tool for anyone who needs to delve deep into how memory is used on Windows. Its detailed breakdowns go far beyond what tools like Task Manager can offer. You can follow the guide here to install and use VMMap.
Also Read: Free software to monitor System Performance & Resources in Windows.