A Blue Screen error occurs on the Windows system after a system crash. The blue screen pops up unexpectedly, forcing you to restart the system in the middle of your work. The error is an unpremeditated sign and is quite frustrating when you find it hard to debug the problem. Fortunately, there are many handy tools like the Windows Debugger Tool (Windbg), which allows you to read the error report for troubleshooting and solve the BSOD error.
Causes of BSOD error
The BSOD error is displayed when your operating system reaches a threshold limit where the system is vulnerable and can no longer function safely. BSOD usually occurs for several reasons like faulty drivers, corrupted Windows registries, overheating, misconfigured device drivers, corrupted files, outdated drivers, overclocking, bad software and other system hardware issues.
Fixing BSOD error
The Blue Screen error, also called a Stop Error causes your Windows system to stop completely, and you may have to reboot the system to continue to operate.
However, before the reboot, users are recommended to note the error code displayed on the blue screen. That being said, the BSOD error pops up mostly when your system is unable to recover the kernel-level error. The error message usually displays a whole load of crash information with driver data associated with the error, and other information with their possible fixes.
When the system crashes, Windows creates minidump files and dumps all memory data, including the error details, to a hard drive for future debugging. There are many handy tools like Bluescreen View and Windbg that allows you to read the minidump files for troubleshooting. You can use Bluescreen view to quickly and easily analyze the error. For more advanced research, you can use Windbg to solve the BSOD issue.
What is Windows Debugger Tool (Windbg)
WinDbg, also known as the Windows debugging tool, is a multipurpose debugger that automatically scans all minidump files created after a BSOD crash. The tool is used for more advanced analysis of tricky errors and is available for free download as part of the Windows SDK. For each crash, the debugging tool provides details about the driver that was loaded at the time of the crash and other advanced crash information to help diagnose the root cause of the blue screen error and eventually identify the problematic drivers. In this article, we explain how to use the Windows debugging tool (WinDbg) to read the crash report.
New features of WinDbg

Simpler and less intimidating
WinDbg is often found intimidating, but the new version is said to be less intimidating, with a simpler, better interface. The tool is specifically redesigned for beginners to help them understand.
Earlier, it was a bit difficult for new users to get used to the toolbar or menu. But, the new version has a Ribbon that includes features that are currently plain, but will soon get the specific contexts while you are debugging.
The new File Menu is simpler, and users can easily select the options before they start with the debugging session. The attached dialog is now simpler and more organized. You can also launch some background tasks or your Microsoft Store App without setting up with PLMDebug.exe.
Improvements and Modernizations
After quite a while, WinDbg has some quality improvements and modernization which include a darker theme, some window improvements, and the recent targets.
Dropping the glaring brightness, WinDbg now comes with a dark theme which is preferred by most users. The new version of WinDbg will now remember all your settings and recent debugging sessions, rather than having your IP and KDNET on a sticky note on your monitor. All your recent sessions will now be logged in the File Menu as your recent target list.
Microsoft has now made Windows more synchronous and also lets users cancel the loading by running another command. There are various other window improvements listed too.
Data model
The data model up until now was accessible only through the dx command and JavaScript. Still, with the WinDbg preview, the data model is more extensible, powering locals and watch windows. JavaScript extensions and NatVis will now be reflected in those windows.
WinDbg preview comes with a new window termed as a modal window which will help you with your own modules window with @$scurssion.Modules. It will also show up the results of any model query in a table or a hierarchy view.
WinDbg comes with a built-in scripting environment where you can write and execute your NatVis and JavaScript directly from the debugger.
While Microsoft announces the new features and improvements via their blog, the WinDbg is still a preview version and comes with some restrictions. Only the devices running Windows 11/10 can install it via Microsoft Store.
The workspace of the new WinDbg Preview has changed a lot and is quite different and better than the previous version, but since it is a preview, there might be some bugs and errors, which will be addressed.
How to use Windbg on Windows 11
Installing Windbg
Download the standalone Windows SDK here.
Run the installer and choose the default installation path.
Accept the license and select the feature Debugging tools for Windows to install the debugger.
")
Click on the Install button.
Using Windbg to debug a Blue Screen error
Go to Start and type WinDbg (x86).
Right-click on WinDbg tool and select Run as administrator.
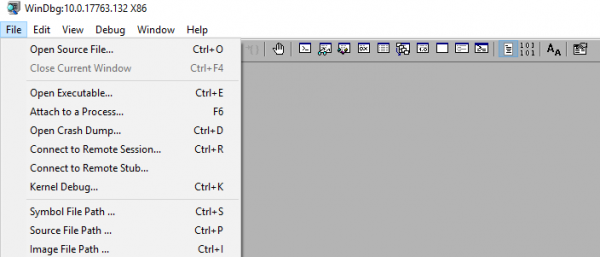
Go to File and click on Open Crash Dump from the menu.
Navigate to the path C:\Windows\Minidump and click Minidump folder.
In the Minidump folder, click the dmp file you want to open.
WinDbg will now analyze the file and Wait till the Debuggee not connected disappears at the bottom of the window.
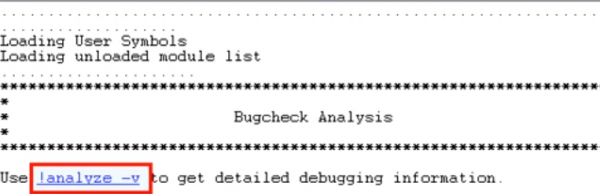
Click on !analyze -v in the command prompt and wait till the analyze is complete.
To get more driver information, locate the MODULE_NAME from the analysis results and click on driver link.
Once you identify the problematic driver, you can choose to either update or reinstall the problematic driver from the manufacturer’s web page in order the fix the problem.
Hope this helps!
PS: John Carrona Sr adds: You’ll get symbol errors if you don’t set a valid symbol path. The easiest method is to click on File…Symbol File Path and enter:
srv*c:\symbols*https://msdl.microsoft.com/download/symbols
This has to be done each time you open WinDbg – unless you save the Workspace for later use.
Examples of errors that you get when not using symbols is seen at stackoverflow.com.
Read: A debugger has been found running in your system.