Microsoft Excel is the most useful and easy tool for business analysts. It has many useful formulas, features, and bundles of interactive charts. But, most of us are not familiar with all of them, and there are some more features that are powerful and easy to use to make our work simpler. You might not have noticed some of the useful Excel features like Sparklines, Slicers, Conditional Formatting, and other formulas which add value to your work. In this article, I will take you through them and will give you an idea of what those are and how to use them.
Useful Excel Features, Functions and Formulas
Sparklines, Slicers, Conditional Formatting, SMALL LARGE, Remove Duplicates Excel Features
Among many Excel features, there are some hidden features that are easy to use and you may not know all of them. Without any further delay, we will look at 5 such Excel features.
Sparklines Excel Feature
Sparklines are used to visualize trends in data across rows. It fits in a single Excel cell, saving space on the worksheet. This is a cool feature and is very easy to use. Calculating the trend for row data and placing the visualization in a single Excel sheet is really a great feature to use.
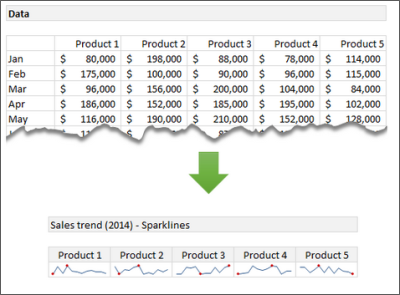
In order to create your own Sparklines, select the range of data. Click insert on the ribbon and select the type of Sparklines (Line, Column or Win/Loss). Next, enter the target range where you want to show the Sparklines.
Conditional Formatting Excel Feature
Conditional Formatting is a well-known feature of Excel. It is used to visually present the data based on the conditions met. It is also useful to create heat maps. This would be helpful to find interesting patterns by exploring the data effectively.

To create the heat map, select the data and head over to the ribbon. Under Home, click Conditional Formatting and then click Color Scales. Now, pick the color scale. You can even set the color scale by editing the formatting rule.
SMALL and LARGE Excel Functions
We all know about MAX and MIN functions. They give you the maximum and minimum values of the selected data respectively. But, in order to find the 1st, 2nd, 3rd or nth largest or smallest value of the selected range if data, we can make use of LARGE and SMALL functions respectively.
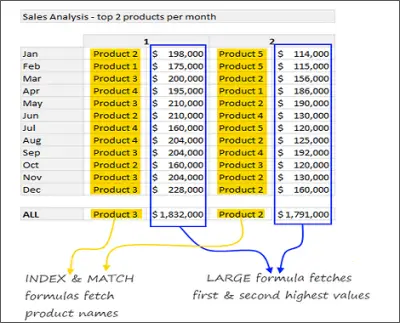
In this example, in order to find the top two products for each month, we made use of MATCH and INDEX functions along with LARGE and SMALL functions.
Remove Duplicates Excel Feature
Do not blame me for mentioning this feature in this list. It is very important to remove redundant data from the vast amount of available data. It is one of the best ways for cleaning and organizing the data and so thought of having it in this list of powerful Excel features. The ” removing Duplicates feature is helpful to remove duplicates, which is the most important problem that we face.

To remove duplicates, select the data and head over to the ribbon. Under Data, click the Remove Duplicates button and see the data without duplicates.
Slicers Excel Feature
Slicers act as visual filters. It helps you to visualize the subset of data as a connected chart or as raw data. For example, if you want to show the trend of sales of various products, then you can create the interactive sales trend chart using Slicers. Based on the product you select, the respective chart is shown.
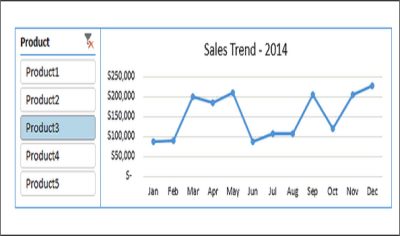
In Excel, if you want to add Slicer to your charts, select the data range and click on insert > Slicer. Now, select the part of the data you want to use as a filter. In the image above, Product column is used as a filter.
How many of you have used these powerful and useful Excel features? If you want to add more features to the list, please let us know through comments.
Also read:
- Microsoft Excel Tutorial for Beginners
- Excel Tips and Tricks for beginners
- Advanced Microsoft Excel Tips and Tricks
What are 10 features of Microsoft Excel?
Microsoft Excel comes with countless features and options that you can use to get things done in various situations. However, when it comes to the best ten options or features, you can check out Conditional Formatting, Themes, Table within table, PivotTable, Charts, Equations, Data Visualizer, 3D models, etc. The best thing is that Excel allows users to install add-ins to enrich the user experience.
What are the advanced features of MS Excel?
Excel includes both easy-to-use and advanced features. For example, you can insert a table within the spreadsheet, use countless functions, validate data, use input restrictions, match with an index, and more. The best thing about Excel is that you can use any function in a nested method. In other words, you can apply one function multiple times and dynamically.