Microsoft Time Travel Tracing Tool or TTTracer.exe is a support tool used to diagnose problems. This diagnostic tool can be used to collect time travel traces of given processes so that the traces will be analyzed by Microsoft Support for troubleshooting purposes. It is designed to upload trace files up to 2 GB after compression.
Microsoft Time Travel Tracing Diagnostic Tool

Time Travel Tracing or iDNA tracing consists of two elements says MSDN:
- A utility to capture TTT trace
- An extension to Windbg that allows loading the trace for analysis
When the trace is loaded into WinDbg, it allows the user to move back and forth in the process execution time. It thus helps users debug Windows interoperability behaviors without the need to reproduce the problem or remote live debugging.
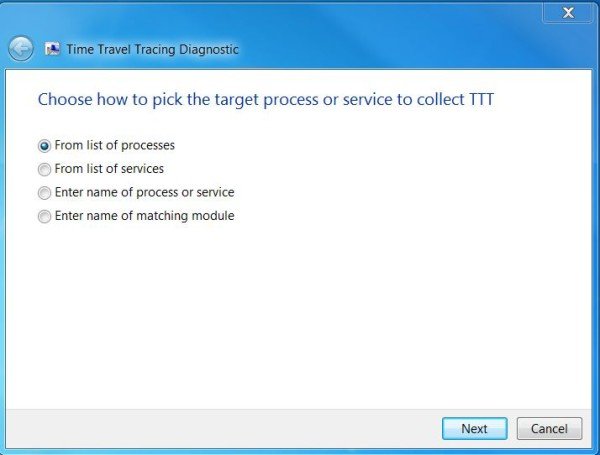
- When you run the Time Travel Tracing diagnostic, you will be prompted to select one of the tracing options:
- Select one or more processes from a list of currently running applications on your computer.
- Select one or more processes by entering the name of the program.
- Select one or more processes by entering the name of a matching module that the program loaded.
- Define one program that will be traced after it starts.
The collected traces will be automatically compressed and uploaded to Microsoft Support. If the file size is more than 2 GB, even after compression, some of the files will not be uploaded but will be left back on your system. You may need to contact support to ask for an alternative way to upload the remaining collected information.
You can read more details about Time Travel Tracing Diagnostic on KB2716889.
Related Links:
- If you face printing issues and want to learn how to use Time Travel Tracing Tool, see KB2728320.
- To learn about the data collected by the Time Travel Trace and Network Capture diagnostic, visit KB2853429.
How to run the Microsoft Support Diagnostic Tool in Windows may also interest you.
Does Microsoft have a diagnostic tool?
Microsoft offers Hardware Diagnostic Tool to identify values or issues with hardware devices or software. It also provides the color key to find based on file attributes, configuration manager, error information, and warning information. You can filter the reports based on all devices, current devices, devices with problems, and files.
How do I check my PC diagnostics?
You can check using tools such as Performance Monitor and Windows Memory Diagnostic tools to check on the system performance. If your PC is failing, these tools can help you figure it out for you.
