We all know aware of and use Ctrl+C and Ctrl+V tips to execute the copy and paste commands easily. Perhaps, it is one of the most widely used functions and well-known tips of the Windows operating system. Sometimes you may want to prepare a presentation, in which you want to use important graphs from your Excel sheets and post them in your PowerPoint slide. Now when you use Ctrl+C and Ctrl+V, the end results aren’t too good and are definitely what you may be looking for.
![]()
How to copy Graphs from Excel to PowerPoint
To copy graphs from Excel to PowerPoint, follow these steps:
- Open the spreadsheet on your PC.
- Select the graph you want to copy.
- Press Ctrl+C to copy the graph.
- Open the PowerPoint app.
- Press Ctrl+Alt+V.
- Select the Picture (Enhanced MetaFile) option.
- Click the OK button.
To learn more about these steps, continue reading.
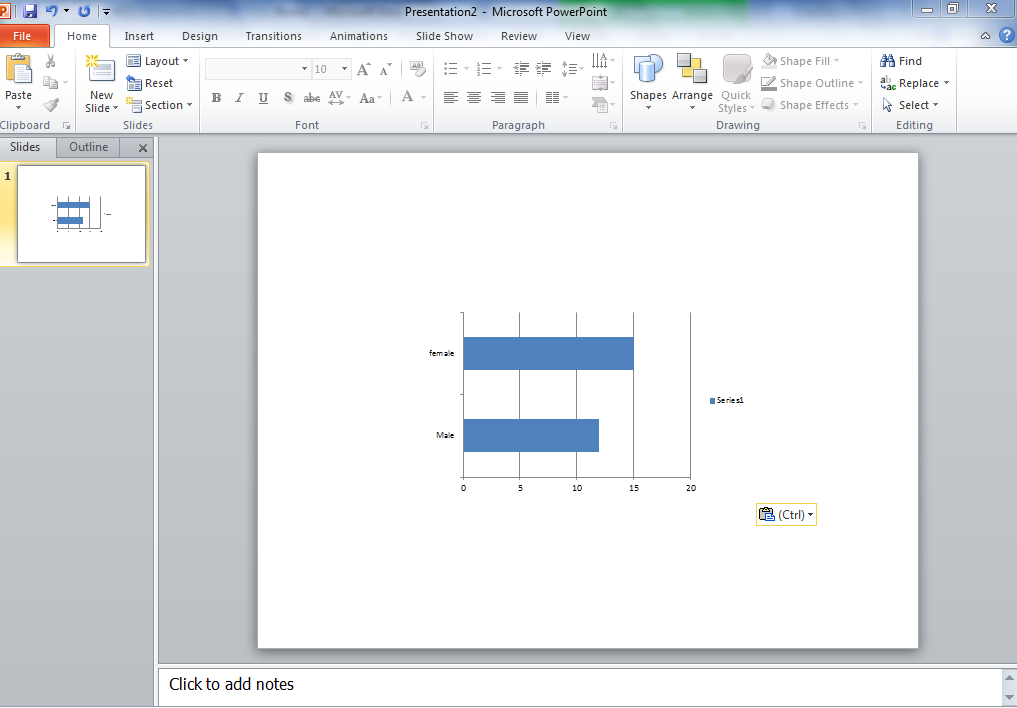
This is the look you get if you use Ctrl+C and Ctrl+V
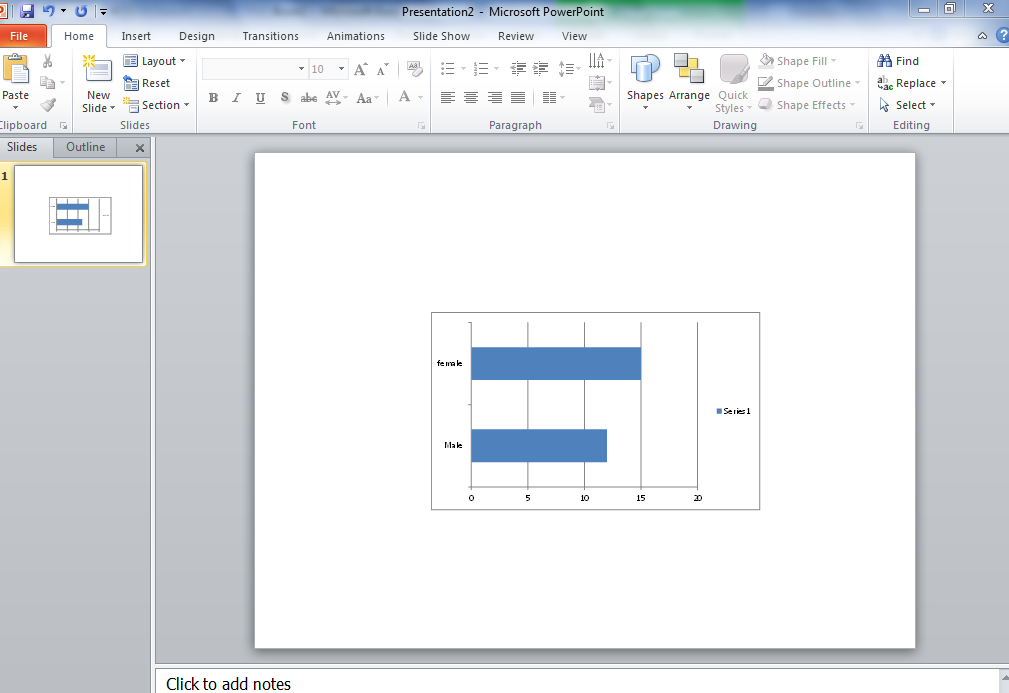
And this is the look you will get if you follow our tip.
To achieve a perfect and professional look, you can follow these steps:
- First open the Microsoft Excel file, whose graph you want to use in your presentation. I am using a dummy Excel file which has a hypothetical graph showing some relation between males and females.
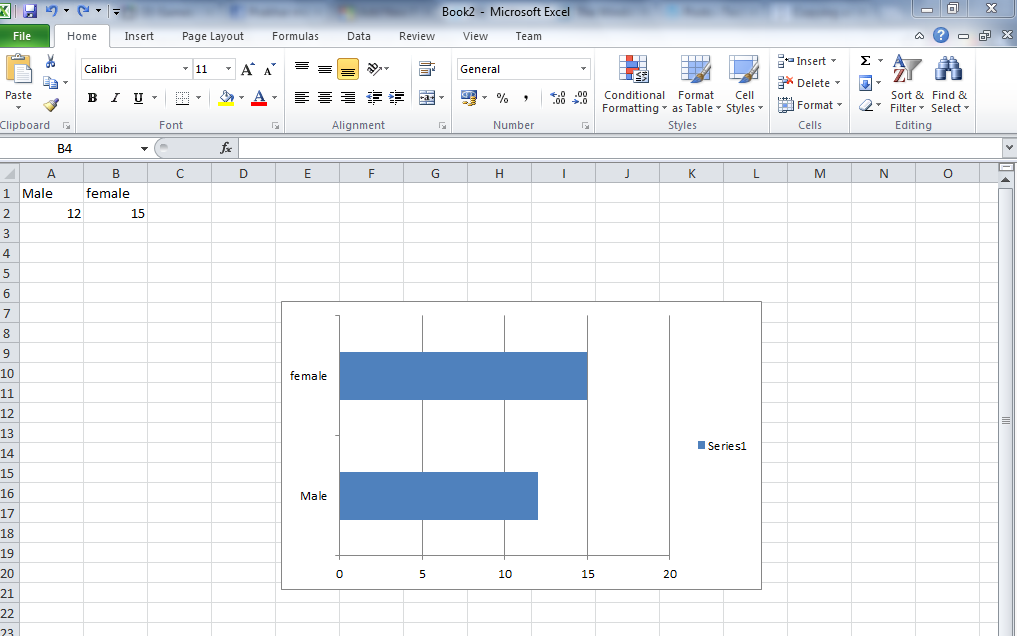
- Now select the graph in your Excel file and press Ctrl+C.
- Open your Microsoft PowerPoint presentation.
- Press Ctrl+Alt+V. A Window will come out.
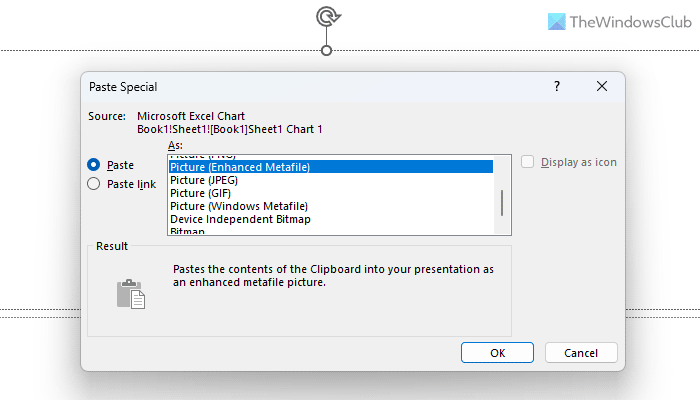
- Select Picture (Enhanced MetaFile) and click on OK. You will see the graph with proper outlining and a lot more professional look.
So in short, you actually used Ctrl+Alt+V instead of traditional Ctrl+V. The whole credit goes to Windows Enhanced MetaFile which preserves all the graph-related information like edges, colors, etc.
Read: This image cannot currently be displayed in PowerPoint
How do you copy and paste a graph from Excel to PowerPoint?
To copy and paste a graph from Excel to PowerPoint, you can go through the above-mentioned steps. As it is a bit problematic to get it done, you need to use the Picture (Enhanced MetaFile) option to make it happen. For that, copy the graph from Excel and press Ctrl+Alt+V in PowerPoint to get the options.
How do I copy from Excel to PowerPoint and keep formatting?
In order to keep the formatting while copying things from Excel to PowerPoint, you need to select an option called Keep Source Formatting. Otherwise, it will paste texts without any formatting. No matter whether you want to paste texts into Word or any other app, the process is the same for all of them.